In this tutorial, we’ll learn how to calculate Standard Deviation in Excel. Standard deviation is one of the most widely used formulas in statistics. It is used to calculate the deviation from the mean or average in a data-set.
Also read: CAGR in Excel – How to Calculate CAGR in Excel?
What is Standard Deviation?
Standard Deviation refers to the amount of variability or deviation from the average value in a given set of data, resulting in analysis of whether the data points are all clustered together, or very spread out. Standard Deviation is expressed with the Greek symbol sigma (σ).
The Mathematical Formula for Standard Deviation is:
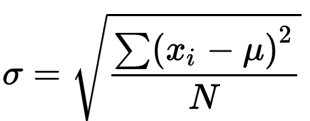
Where:
σ = Population standard deviation
N = Size of the Population
Xi = Each value from the population
μ = The population mean
Benefits of Standard deviation
- Allows us to understand the variability and consistency of a data-set.
- A reliable source of information
- It is one of the most reliable formulas to compare two different data-sets.
- To plot the very useful Standard Deviation Curve – ‘Bell Curve'(as shown in featured image)
Real-life Usages of Standard Deviation
- Used to predict temperature of regions.
- For developing a general sizing system so to develop a new product line. This is specifically used by designers.
- Analyzing the team performance in sports.
- Predicting trends in the Stock Market.
- To get approximate data for large number of data values. (Example: Population)
Applying Standard Deviation in Excel
Follow the below step-by-step tutorial: to calculate Standard Deviation (σ) in Excel
Step 1: Standard Deviation formulas in Excel
The first and foremost step involves the understanding of the data set.
Here is the table to help you out with all the formulas in excel and their use cases:
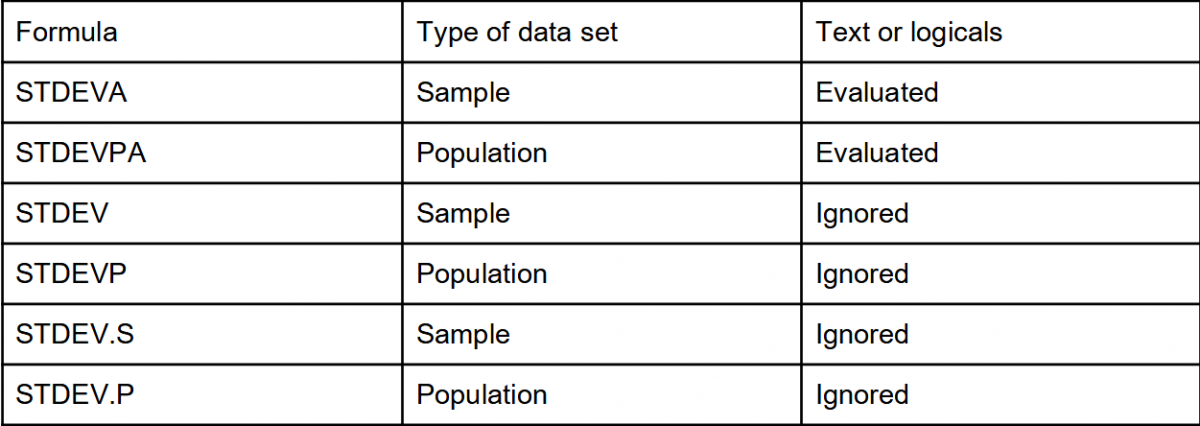
Note:
Here, ‘S’ and ‘P’ represent sample and population respectively.
A sample is a small set of data taken from large sets of data or populations.
Step 2: Analyzing the Data set
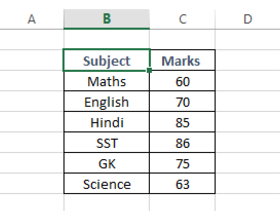
Let us take a sample data, of the marks scored in 6 subjects by a student out of 100 as follows:
Step 3: Calculate Average
Calculate the average of the data as shown below. Use =AVERAGE formula in the active cell and select values to calculate the average. Here, cell C3 to C8 values are taken (C3:C8 represents the same).
After selecting the average function, to select all the data cells, left-click the mouse button and select all required data by dragging.
You can also manually calculate average using the formula: Average = (Total Sum of all Entries/Data) ➗ (Total number of items/data)
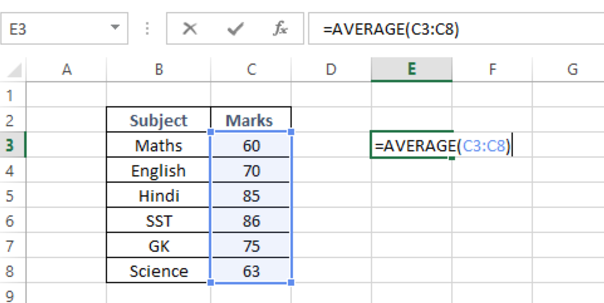
In the above example we have calculated average of all the ‘Marks‘ scored by the student in all the six subjects.
The answer to our above calculation is Average = 73.167
Note:
Calculation of average is important to know the consistency of the data.
Let us consider a situation where the average of two data sets is 60. The standard deviation of the first data turns out to be closer to the mean, while the latter had a big gap or deviation. This implies that the data closer to average is more consistent.
Step 4: Substitute values in the Formula
Since our sample data is with no text or logic, we will apply the STDEV.S formula (refer to Step 1).
Tip: Formula suffix says a lot about its usage. It can easily be identified through the .S and .P at the end .’S’ and ‘P’ stand for sample and population respectively.

Note: If remembering where to use STDEVA, STDEVPA, STDEV, STDEVP, STDEV.S, STDEV.P is a difficult task for you, then you can hover over the general formula. Excel will automatically show the usage of the formula as shown in the above screenshot.
In this case of marks scored in examination use the formula =STDEV.S
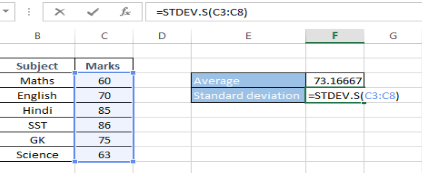
Step 5: Calculating Standard Deviation in Excel
Press Enter and the standard deviation of the marks scored will apply and get calculated in the active cell. Remember to select the required values of marks as done for average.
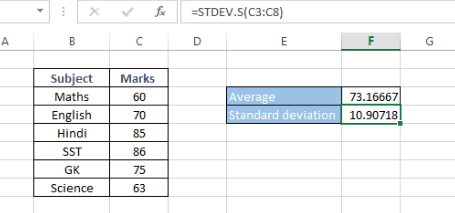
The Result of our calculation of Standard Deviation is σ = 10.90718. This means that our data set of ‘Marks’ is deviated by 10.91 (rounded) from the mean or average of our data set.
Also read: How to Calculate Compound Interest in Excel?
Conclusion
That’s it. We’ve learned how to calculate standard deviation in Excel using simple formulas and applying them to the different datasets will now become easy. Practice enough and calculating standard deviation will be second nature to you.
