In this article, we’ll learn to interpolate in Excel. Interpolation is a method for estimating or finding a value on a line or curve between two known values. Many types of analysis, such as investing in growth, predicting statistics, developing strategies, insurance decisions, price movements, stocks, and share markets, employ this type of forecasting.
Linear interpolation is the process of predicting the future value of a variable using current data. A straight line is drawn in MS-Excel to link two known values, and the future value is estimated using a basic mathematical formula or the FORECAST tool.
Interpolate in Excel With Examples
Let’s look at some examples of how to interpolate in Excel.
1. Simple Mathematic formula
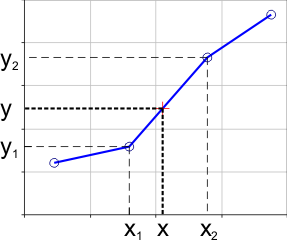
Linear interpolation is the process of estimating a new value by drawing a straight line between two nearby known values.
If (x1, y1) and (x2, y2) are the two known values then, the y value for some location x is given as:

Consider the following scenario
We have a basic dataset with two known x and y values, and we want to interpolate a value (i.e. determine the equivalent y value for the x value) as follows:

To interpolate this value, use the following simple formula:
(x – x1) * y= y1 + (x – x1)
x=22.5 in this case.

As a result, when we apply this algorithm to the provided dataset, we receive the following interpolated y value:

So, as we can see in the picture above, we’ve interpolated a value based on two known x and y values. It is possible that memorizing the formula will get challenging at times. In such instances, the FORECAST function might be utilized.
2. Forecast Function
Let’s assume we want to use the FORECAST function to interpolate the identical value from Example 1.
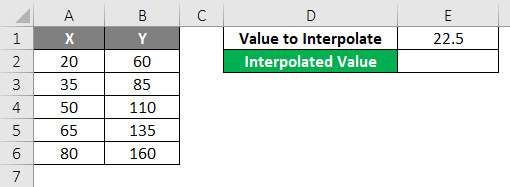
The FORECAST function calculates a number based on previous data and a linear trend. The syntax is as follows:
FORECAST(x, known y's, known x's), FORECAST(x, known y's, known x's)
Where,
- x: This is the value or data point for which we want to forecast or interpolate the matching value.
- known y’s: This is the range of y values that is known.
- known x’s: This is the known x value range.
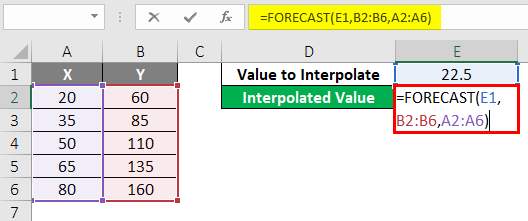
So, let’s have a look at what occurs when we use the FORECAST function to interpolate the provided x value, as realized in the image below:
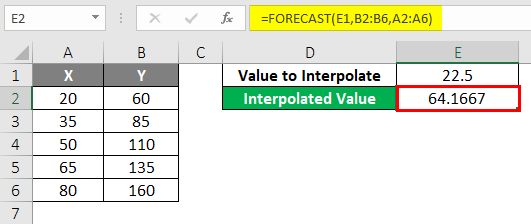
As can be seen in the image above, the FORECAST tool works nicely for this as well.
3. Different Forecast function
Let’s assume we have a dataset of a retail business with a number of days and the firm’s sales in those days (i.e. the number of units sold in those days), as shown below:
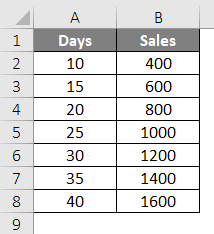
In this scenario, the sales are linear (which can also be verified manually or using a line graph). Let’s look at how the FORECAST function is used when the known y’s and known x’s are calculated with the OFFSET and MATCH functions:
To start with, let’s look at the syntax of the OFFSET and MATCH functions:
OFFSET method
The OFFSET method returns a cell or a range of cells based on the height and width of given rows and columns in rows and columns. The syntax is as follows:
OFFSET (reference, rows, cols, [height], [width])
where,
- reference: That’s the point at which the count of columns and rows will begin.
- rows: The number of rows below the beginning reference cell to offset.
- cols: This specifies how many columns should be offset from the initial reference cell.
- height: Optional; This is the height of the rows in the returned reference.
- width: Optional; This is the width of the columns from the returned reference.
Match method
The Match function will return the relative position of a search value in a row, column, or table that matches the supplied value in the order specified. The syntax is as follows:
MATCH (lookup value_lookup_array, [match type])
where,
- lookup value: That’s the value from the lookup array that has to be matched or examined.
- lookup array: This is the array or range of cells that will be searched for the lookup value.
- match type: This is an optional parameter that can be set to 1, 0, or 1.
This match type’s default value is 1.
MATCH will discover the largest value less than or equal to the lookup value for value 1, and the values must be in ascending order.
It looks for the first value that is precisely identical to the lookup value for value 0. It will discover the lowest value higher than or equal to the lookup value for the value -1, and the value must be in descending order.
Now, if we want to forecast revenues for a period of 28 days, we may utilize the following functions:
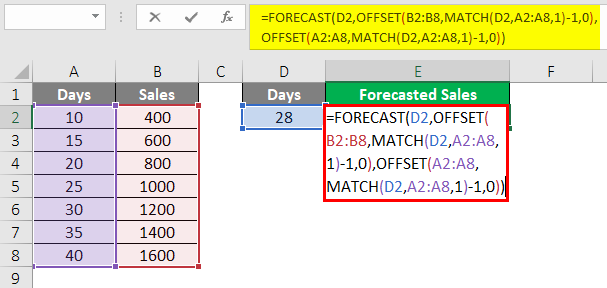
As a result, the known Y’s are selected using the first OFFSET function, which is utilized as the second argument in the FORECAST function (dependent values, i.e. the sales).
The known X’s are selected using the second OFFSET function, which is utilized as the third argument in the FORECAST function (independent values, i.e. the number of days).
The MATCH function, which is a parameter in the OFFSET function, is used to create the predicted value position and hence the number of rows. The second argument in the MATCH function should be 0 since the dependent value is desired on the same column that is selected.
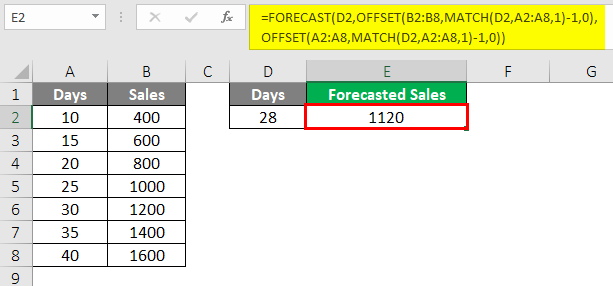
So we projected or forecasted the firm’s revenues to be 1120 over the next 28 days. Similarly, we may use the FORECAST function to predict the firm’s revenues for a particular number of days.
Important things to remember about Interpolation in Excel
- Interpolation is the act of creating a simple function from a discrete values dataset that runs over all of the supplied values and may be used to forecast values in between the given ones.
- It’s utilized to figure out what data could exist outside of the data that’s been acquired.
- In MS Excel, linear interpolation is not an exact approach, but it is time-saving and quick.
- Linear interpolation may also be used to forecast rainfall, geographical data points, and other variables.
- In instances when the data is not linear, additional interpolation methods such as Polynomial Interpolation, Spline Interpolation, and others can be employed.
- You may even use the FORECAST function to extrapolate or anticipate future values
Conclusion
That’s the end of the tutorial on what is interpolation and how it is calculated in Excel using various methods. Stay tuned to QuickExcel for more interesting tutorials.
