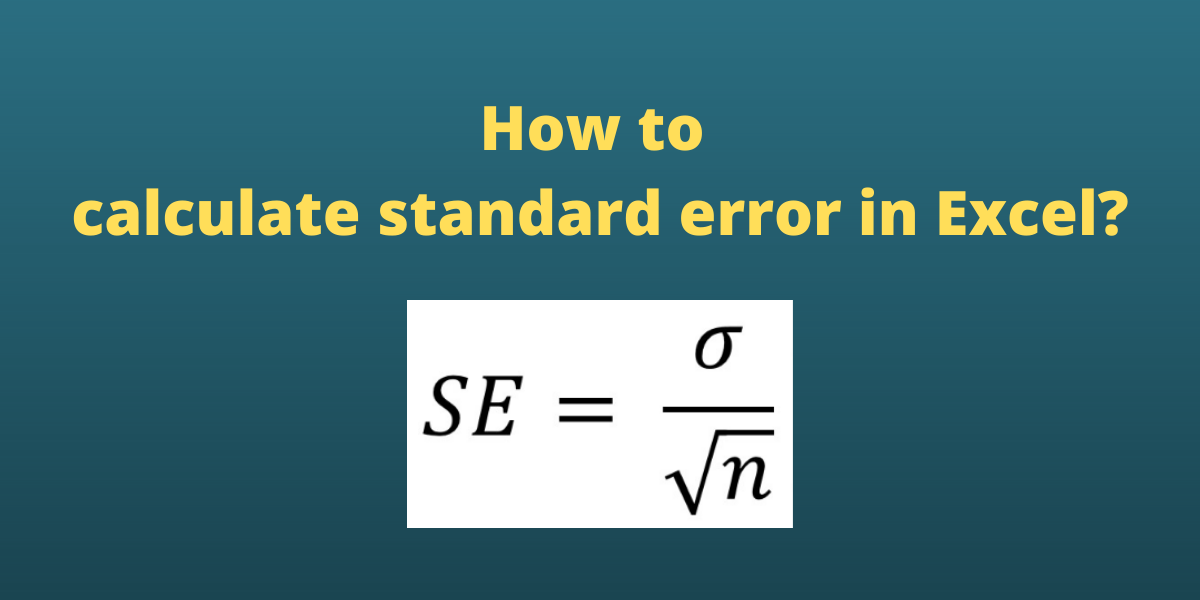
The Standard Error of the Mean (SEM) is a statistical measurement that approximates the difference between the sample mean (average) of the data from the true population mean. The formula for standard error is:

where xi is a data point in the data set, x bar is the arithmetic mean of the data set, and N is the number of data points in the data set.
We can calculate variance in Excel both using the mathematical formula and built-in functions such as STDEV.S and SQRT.
Also read: How to Calculate the Square Root in Excel?
Using the Standard Error Formula in Excel
Let us consider a sample data set containing integer values for which the standard error of the mean is sought.
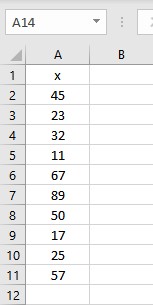
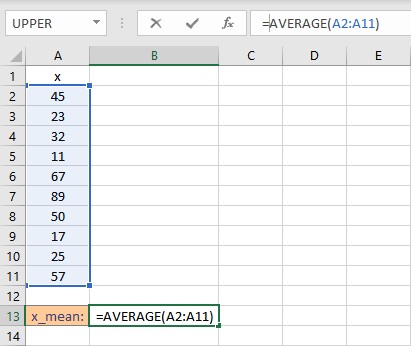
First, we need to calculate the mean of the numbers as the mean is a parameter in the formula for standard error. To calculate the mean in Excel, we use an in-built AVERAGE function. The syntax of the AVERAGE function is =AVERAGE(start cell reference:end cell reference). Follow these steps to calculate the mean in Excel:
- Select the cell where you want to display the mean.
- Type the formula =AVERAGE( and select the data range containing the values for which mean value is sought.
- Finish the formula with ). Here, the numbers are present in cells from A2 to A11, so we type =AVERAGE(A2:A11) in the formula bar.
- Press the Enter key to calculate and display the result.
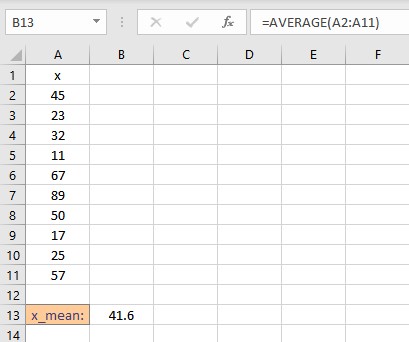
Now that we have calculated the mean, we need to calculate the deviation of individual data points from the mean. The deviations are calculated in the column right next to the data points. Follow these steps to calculate the deviations:
- Select the cell right next to the first data point. In this example, this cell is B2.
- To get the difference, type =A2-$B$13, the $ sign makes the value constant.
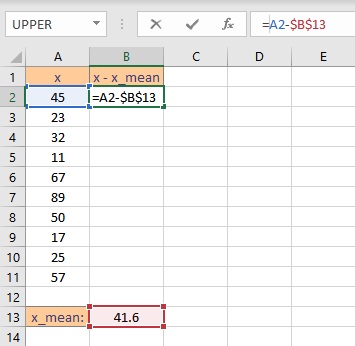
- Press the Enter key to display the result.
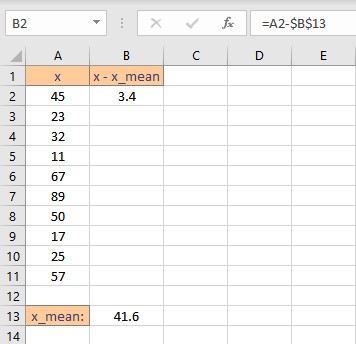
- Simply copy the formula for the entire list to calculate the deviation for every data point by dragging down the fill handle.
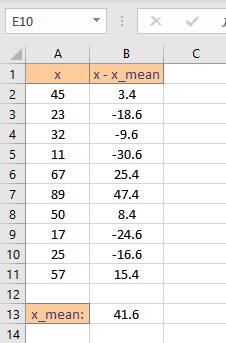
Next, we need to calculate the squares of the deviations. This can be calculated using the caret operator ^. Follow these steps to find the squares of the deviations in the column next to it:
- Select the cell right next to the first deviation. In this example, this cell is C2.
- To get the square, type =B2^2 in the formula bar.
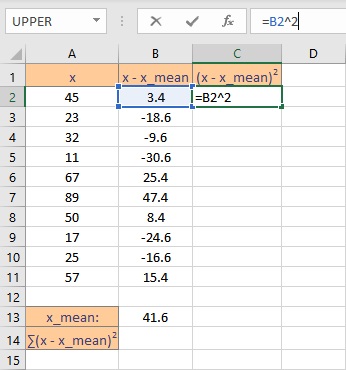
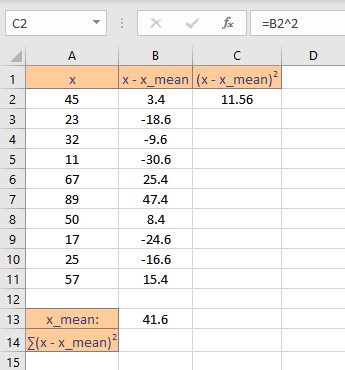
- Copy the formula for the entire list to calculate the square of deviation for every data point by dragging down the fill handle.
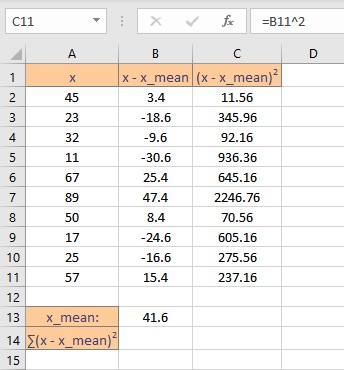
We now need to calculate the sum of the square of deviations. We can do this by using an inbuilt function SUM in Excel. Follow these steps to calculate the sum of all deviations:
- Go to the cell where you want to display the sum.
- Type the formula =SUM( and select the data range containing the values for which summation value is sought.
- Finish the formula with ). Here, the deviations are present in cells from C2 to C11, so we type =SUM(C2:C11) in the formula bar.
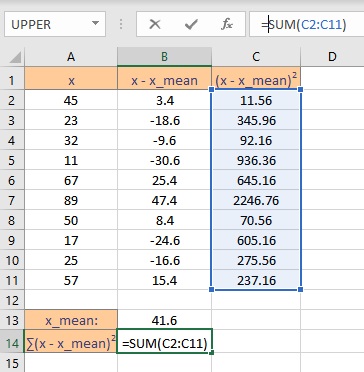
- Press the Enter key to display the calculated sum.
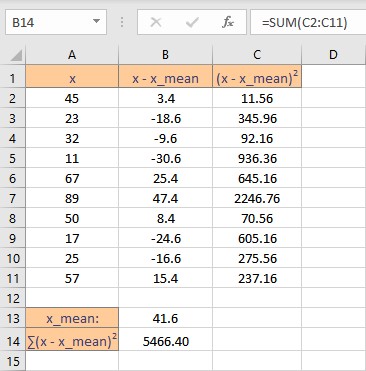
Finally, we can calculate the standard error for N = 10 data points as follows:
- Go to the cell where you want to display the standard error of the mean.
- Type the formula =SQRT(B14/(10*(10-1))), where B14 contains the sum of squares of all the deviations.
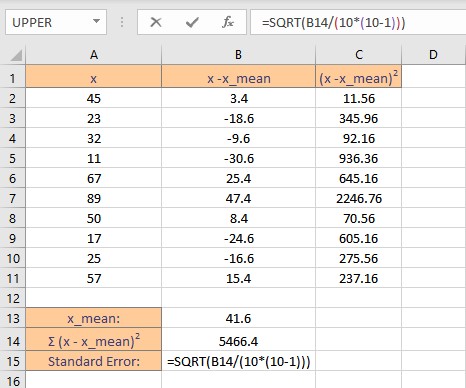
- Press the Enter key to display the result.
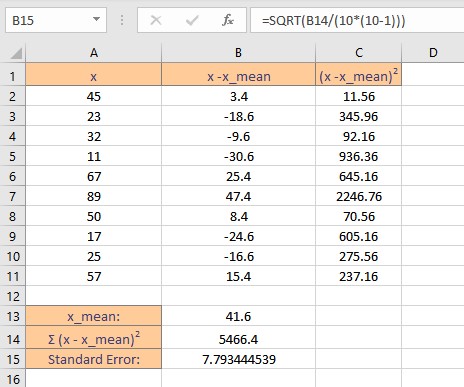
Using the STDEV.S and SQRT function
The standard deviation of the mean can be written as the standard deviation divided by the square root of the sample size.

where σ is the standard deviation and n is the sample size.
The STDEV.S function calculates standard deviation based on a sample. Syntax: STDEV.S(m), where m is the list of numbers or reference to the cell ranges containing the numbers. STDEV.S function uses the following formula

where x is a data point, x bar is the mean of the dataset and n is the number of data points in the data set.
- Go to the cell where you want to display the standard deviation.
- Type the formula =STDEV.S( and select the data range containing the values for which standard deviation is sought.
- Finish the formula with ). Here, the numbers are present in cells from A2 to A11, so we type =STDEV.S(A2:A11) in the formula bar.
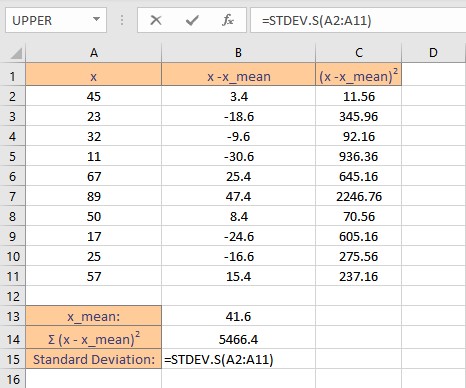
- Press the Enter key to display the result.
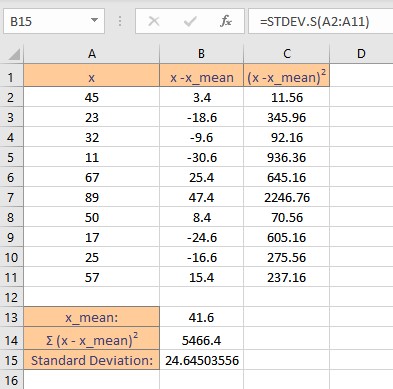
Note: The STDEV.S function ignores logical values and text in the sample.
Now to calculate the standard error for n = 10 data points by following these steps:
- Go to the cell where you want to display the standard error of the mean.
- Type the formula =B15/SQRT(10), where B15 contains the standard deviation.
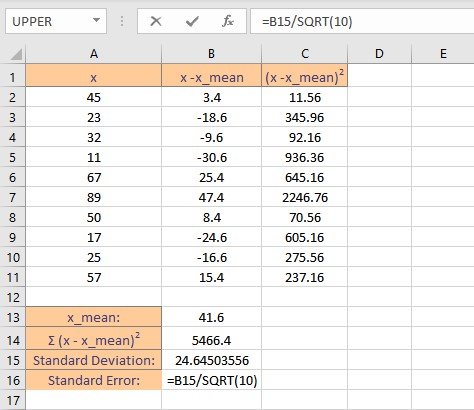
- Press the Enter key to display the result.
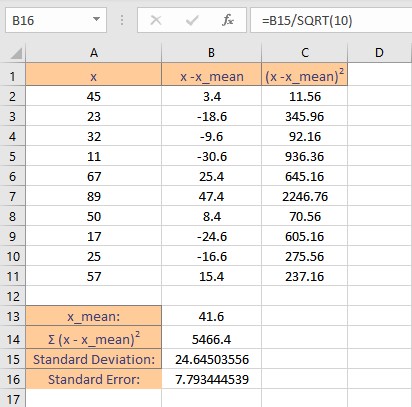
Conclusion
In this tutorial, we learned how to calculate the standard error of mean both by using a mathematical formula in the most simplified form and by using functions such as STDEV.S and SQRT as no dedicated function is available for direct calculation.
