When Excel is built from the ground up to make bring data analysis in a way approachable to the larger masses, there are still some features that are not readily available. One such feature is the Data Analysis Toolpak which contains a wide range of statistical operations that can be exercised over the data.
Also read: Tips to Use Excel’s Filter Tool for Faster Data Analysis
Though there are umpteen formulae inbuilt within MS Excel that can be summoned right after the equals (=) sign, there is more to statistics than that. Determining a sum or a product of the given data ain’t the same as that of calculating the Analysis of Variance (ANOVA) in a given dataset.
It would be a herculean task to put together each piece of information deduced from the given data using a formula & calculate the required statistic if it wasn’t for the Data Analysis Toolpak! Such a blessing to have this feature embedded in MS Excel.
Those within the Data Analysis Toolpak will take us through each step & make it easier to deduce a statistic rather than running around with formulae.
Listed below are some of the things that can be found within the Data Analysis Toolpak.
- Histogram
- ANOVA
- Correlation
- Covariance
- Descriptive Statistics
- F-Test
- Fourier Analysis
- Moving Average
- Random Number Generation
- Exponential Smoothening
- Rank & Percentile
- Regression
- Sampling
- t-Test
- z-Test
Locating the Data Analysis Toolpak
You may wonder where is this feature located within MS Excel. But here’s the catch, it shall be included within the Data tab only if we ask MS Excel to do so.

So how shall we ask MS Excel to do that? The following article shall elaborate on the sequence of steps required.
Adding the Data Analysis Toolpak
One shall get started by clicking on the File menu in the top left corner of the Tabs section as indicated below.

Now one shall be taken to a list of options within the File menu where one needs to choose the Options as indicated below.

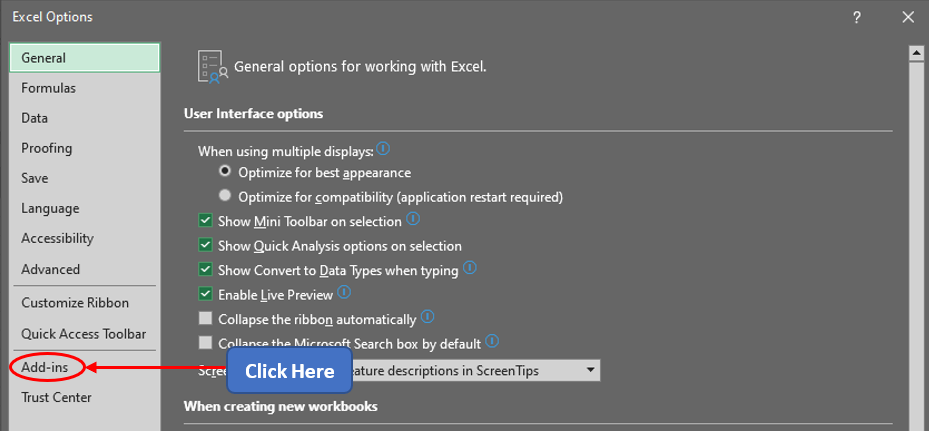
Once done, a dialog box titled Excel Options appears. Now one ought to select the Add-ins option as shown below.

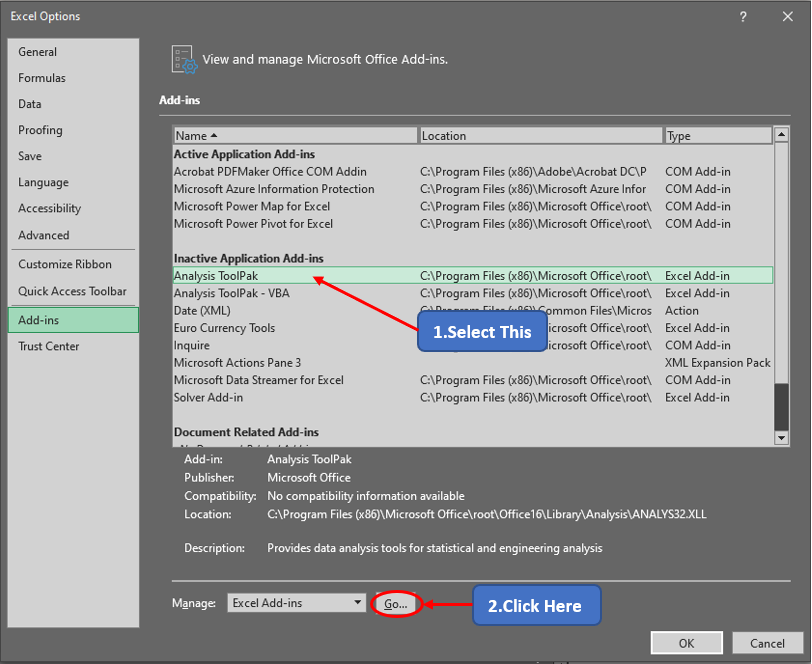
Now one shall get into the add-ins manager which displays the list of add-ins that are both active & inactive. Search for the Data Analysis Toolpak in the inactive region & click on it as shown below.

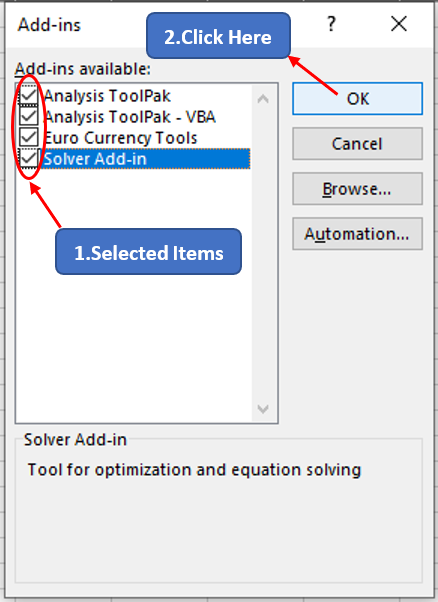
Now the Add-ins pop-up shall appear prompting you to choose the required items from the Data Analysis Toolpak. One ought to tick all the items needed & then click on OK in the same sequence as indicated below.

Once done MS Excel buffers for some time wherein it searches and loads all the necessary scripts in the back-end & then the screen shall appear with a new section titled Analysis within the Data tab loaded with the options from the Data Analysis Toolpak as shown below.

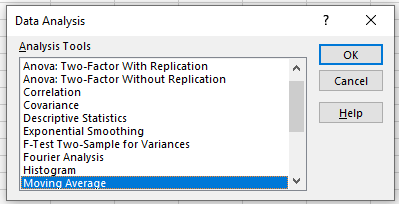
Clicking on the icon of Data Analysis shown in the above image shall make the Data Analysis dialog box with all the features listed at the beginning of this article appear.

One can now choose the required tool within this dialog box to carry out the specific statistical analysis on the dataset in hand.
Conclusion
There are numerous equally interesting & informative articles in QuickExcel that serve to be a great help to those who pursue their journey to excel in MS Excel. Hope this article helped you understand how to add Data Analysis Toolpak in MS Excel & has given you what you came looking for! To know more about how to use a formula in MS Excel, have a look at this article. Until then, Ciao!
