Beta is a financial term widely used in fundamental analysis. It is used to gauge or measure the volatility of a particular stock as compared to the market index (Ex. S&P 500 or Nifty 50).
In simple terms, Beta refers to the sensitivity of a stock price with respect to an index or benchmark. It is regarded as a very efficient and effective measurement of the risk of security.
Formula to calculate Stock Beta
Beta in mathematical terms is referred to as the relationship between Co-Variance of the particular market index or benchmark and the Variance of an asset (can be anything, stock, mutual fund, or whole portfolio).
Note: Strategy Relying solely upon Beta value ( β ) may not result in accurate prediction as Beta is calculated on the basis of the historical performance of the stock/asset and does not take into consideration the future prospects. The value of the Beta is dependent on the time period chosen for calculation.
Mathematics Formula:
Beta is the covariance of the return of an asset with the return of the benchmark, divided by the variance of the return of the benchmark over a certain period. The formula of Beta by this definition stands:
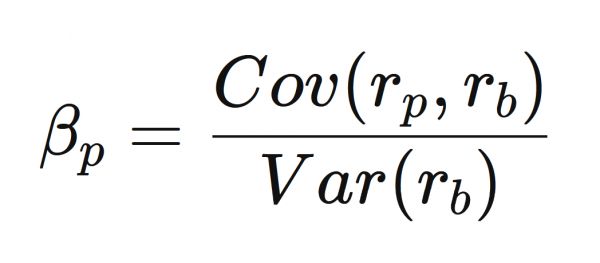
where:
βp: Beta
rp: the return of the portfolio, asset, or stock
rb: the return of the benchmark or market index
Understanding Beta
Now, as we know what is Beta and how to calculate it, we still need to understand the numerical value which would be equated from the above formula for the value of βp, what does it mean, and what does it signify?
So, as Beta is a ratio, it cannot be negative and can take values only starting from 0.
- One (1): indicates a stock has the same volatility as the market
- More than one (>1): indicates a stock that’s more volatile than its benchmark
- Less than one (<1): is less volatile than its benchmark
- 1.5: is 50% more volatile than its benchmark
- Zero (0): indicates no correlation with the chosen benchmark (e.g. cash or other non relatable assets)
If the benchmark or index returns 10%, then a stock with a beta value of 1.5 should return 1.5 times 10% = 150% or more.
Steps to calculate Beta in Excel
Let’s get started with the calculation of beta in Excel by implementing the above mathematical formula.
Step 1. Fetch the Historical Data
To calculate Beta, our first step is ought to be getting the historical data of a stock of a company.
- Go to Yahoo Finance, search for the company or ticker symbol which you want to analyze.
- Now, go to Historical Data, select the time period for which you need to analyze and then confirm it by clicking Apply.
- Download the .csv file of Historical Data
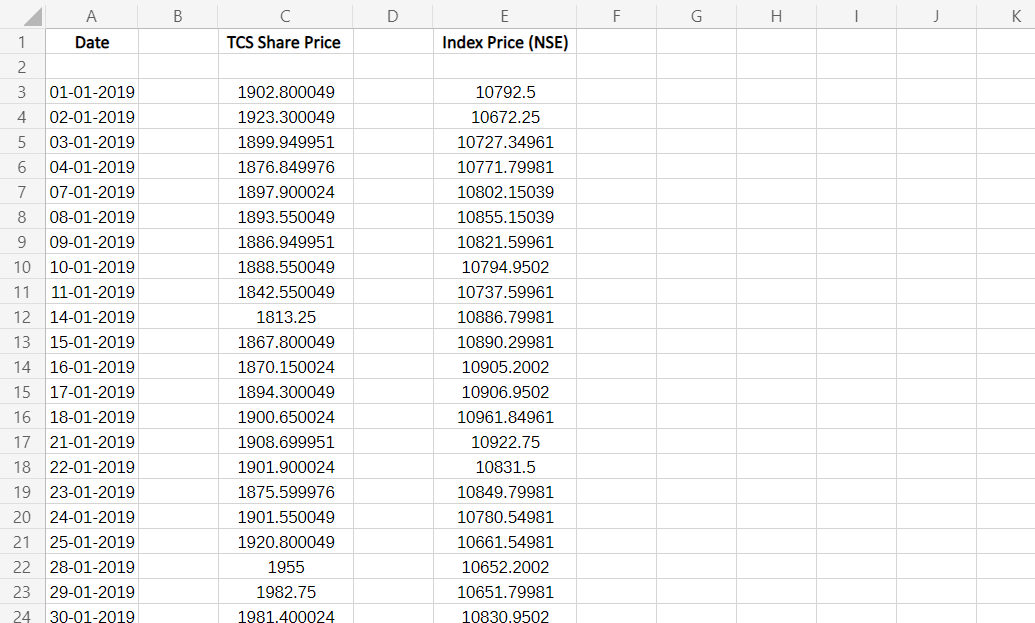
Step 2. Enter data in your Excel Spreadsheet
- Arrange the historical data downloaded with closing prices of the stock to watch and the index/benchmark to compare with.
In our example below, we have used Tata Consultancy Services (TCS) as the stock to analyze and the stock market index used is Nifty 50 to compare, from a historical period from 1st Jan 2019.
Step 3. Calculate Covariance
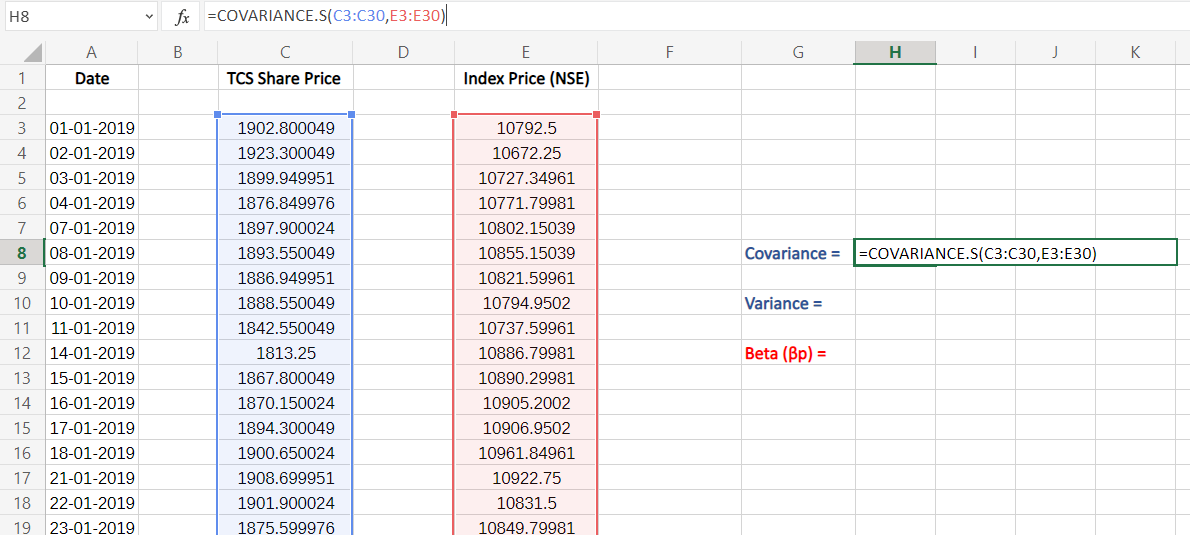
To calculate the covariance of the stock with its index in Excel, we use the =COVARIANCE.S(val1, val2) formula of Excel, which calculates the Covariance of a sample.
- To apply it, we do so by typing the formula name or selecting it to insert

- As a next step, we insert values into our formula, which is range of values (price) of our stock to analyze for val1 and for val2 – the index/benchmark we’ll be using to compare, insert by selecting the whole column or dragging to all the values.
- Make sure you enter correct values in right order which is – of the stock and then of the index.
- Insert the values by selecting all the value in the column, as shown
Step 4. Calculate Variance
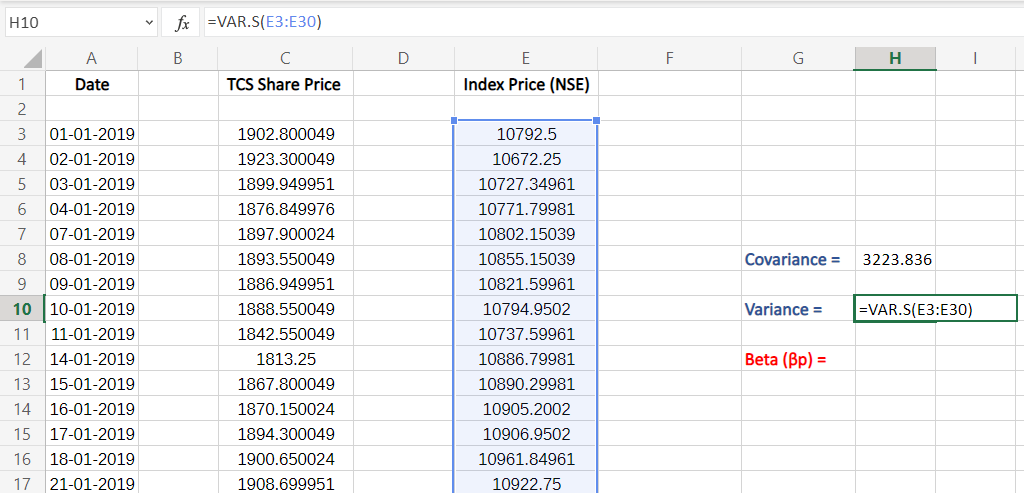
To calculate the variance of the index/benchmark in Excel as per our formula to calculate Beta, we use the =VARI.S(val) formula of Excel, which calculates the variance of a sample.
- To apply it, we do so by typing the formula name or selecting it to insert
- As a next step, we insert values into our formula, which is range of all values (price) of the index/benchmark we’ll be using to compare.
- Insert the values by selecting all the value in the column, as shown
Step 5. Calculating Beta
The process is simple now, we just need to divide the value of Coriance by Variance as per the formula of Beta –
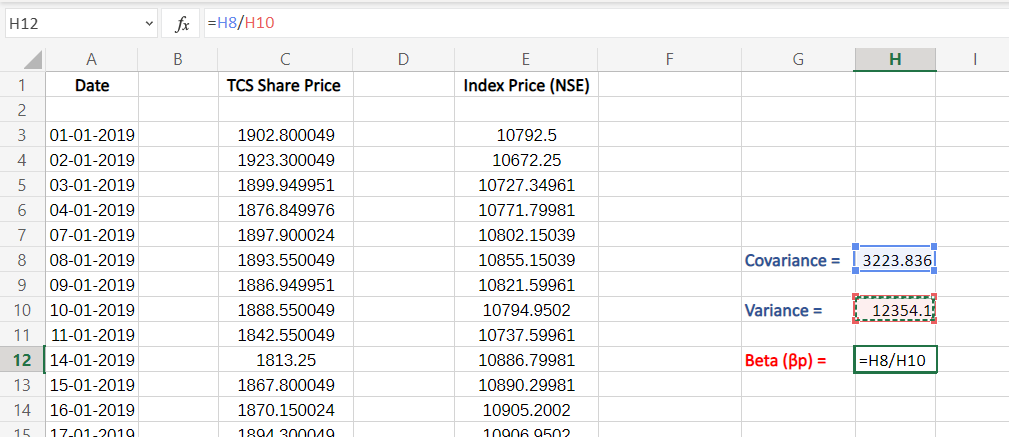
The value we get of Beta might be of varied decimal places, to solve that we approximate the value of our Beta value by using the decrease decimal tool, as shown:
The approximate value helps in better visualization and analysis.
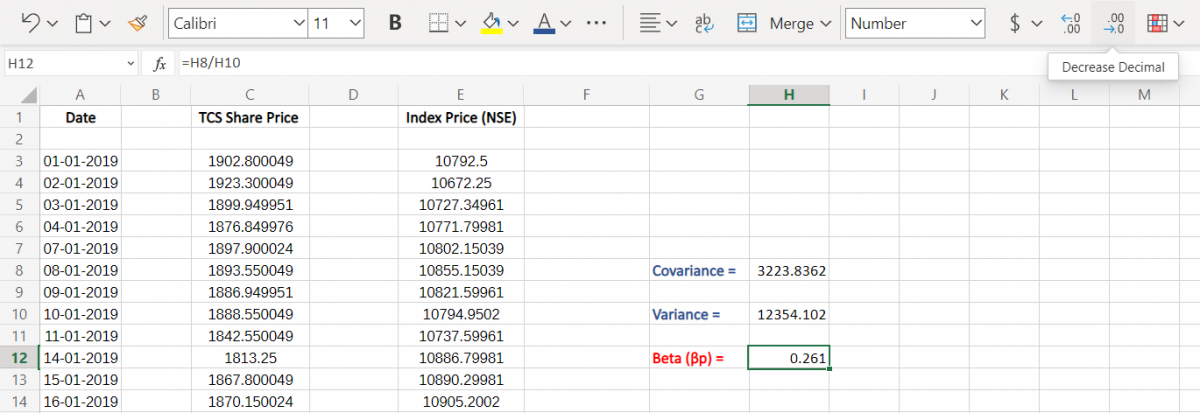
As a final result, we get the value of Beta to be 0.261 which is <1 hence, we interpret that for the specified period the stock price of TCS was less volatile than that of the Nifty 50 index.
Example 2: For clarity
Now, we have calculated beta value on a small dataset (only 30 entries) if, you have noticed in our previous example. But now, to clear your concepts well and help you understand better, we take another example of how to calculate beta.
Here, we calculate the beta value of BAJAJFINSV (BAJAJ FINSERV LTD.) with respect to the BANK NIFTY for a period of 1 year (i.e. 2021), as you may notice for 249 entries. All prices are as per NSE (National Exchange of India). This example also demonstrates that we can take any index or benchmark to compare our stock performance with it:
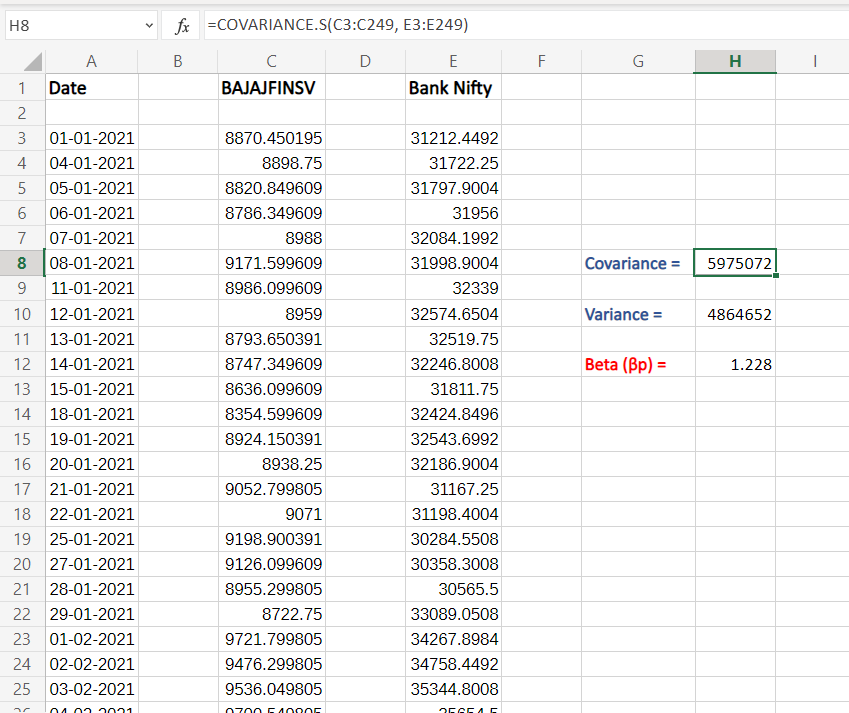
Here, in this example, we get the Beta value equal to 1.228 which is >1, and demonstrates that the stock of Bajaj Finance was more volatile than that compared to Bank Nifty for the same period (1 Year).
Conclusion
That’s it for the tutorial. We hope that you have learned well about Beta Value, what it is, and how to calculate Beta in Excel. And you are ready to implement it yourself and estimate the performance of your desired stock, mutual fund, or portfolio.
