What are the chances you get a six when throwing a dice? What are the chances that there comes a tail when the coin lands after being tossed? What are the odds of anything happening?
PROBABILITY! It gives the answer to everything while being a near prediction at that. In this article, we shall dive into the different steps involved in determining the probability of the following data using a built-in formula in MS Excel.
Using PROB() Formula:
Before we get on with knowing how to use PROB(), let us first understand what PROB() is made of – its components that make the formula function.
The components are given below in the format called ‘Syntax’ of the formula.
=PROB( x_range, prob_range, lower_limit, [upper_limit])
Where,
- x_range – the range of numbers using which the probability is to be calculated
- prob_range – the range containing the probability values corresponding to each of the numbers in x_range
- lower_limit – the lowest value within x_range for which the probability is to be calculated
- upper_limit – the highest value within x_range for which the probability is to be calculated
It is mandatory for one to use all the components of PROB() function listed above, except for the upper_limit. It is also to be noted that the probabilities of different events for a given dataset always add up to ‘1’ i.e. ‘100%’ & this is the maker’s check to verify whether the prob_range is correct.
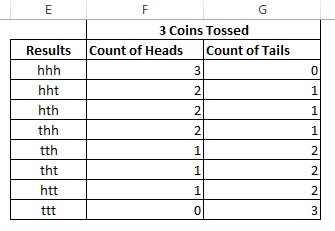
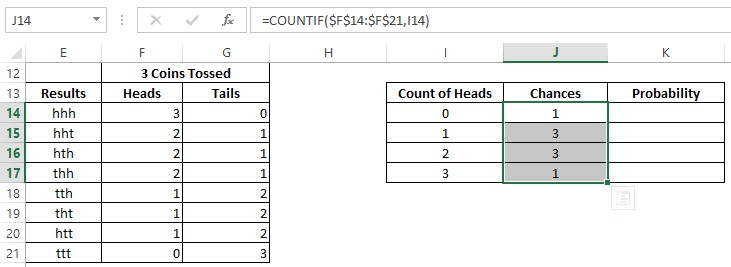
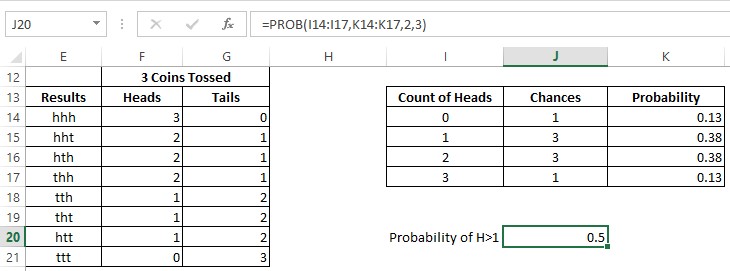
Now let’s say, we would like to know the probability of getting more than 1 Heads in the above data. Now we shall list all the possible counts of Heads that one might get when 3 coins are tossed as follows.

It is also evident from the above image that there are two columns – ‘Chances’ & ‘Probability’ adjacent to the ‘Count of Heads’. Under the ‘Chances’ column, the total number of times each value occurs in the data would be recorded using a COUNTIF formula as shown below.

Hit ENTER & the results shall appear. It is to be noted that there are $ (dollar) signs included within the formula, before the alphabet & also before the number of the selected range. This is to make sure that the selected range doesn’t change when the formula is copied & pasted to the subsequent cells below.
Now to calculate the ‘Probability’for each ‘Count of Heads’, we are going to divide the chances for each count to occur by the total number of chances, which in this case is ‘8’.
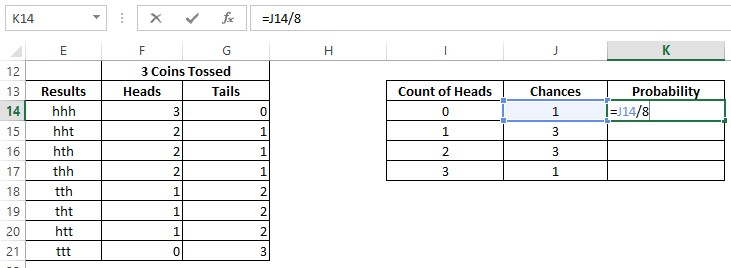
Hit ENTER & the result shall appear. Again the formula would be copied & pasted across all the cells of column K.

Time to circle back to the original requirement to find the probability of getting more than 1 Heads in each toss!
Start with an equals sign (=) followed by PROB & an open parenthesis. The ‘Count of Heads’ is to be selected as x_range, ‘Probability’ column as prob_range, lower_limit to be set to 2 & upper_limit to 3. (The limits are set using 2 & 3 since these are the only possible values of Heads >1).

Hit ENTER & it shall now display the result.
Summary
Now we have reached the end of this article detailing how to use the PROB() function in MS Excel. Hope it has assisted you with the sufficient information that you were looking for. Here is something that elaborates on How to use Pi in MS Excel? Go on & read it to know further. QuickExcel has numerous other articles too that can come in handy for those who are in a quest to know something more in MS Excel. Cheers!
