In this tutorial, we will walk you through inserting and customizing sparklines in Excel.
This piece is a detailed guide to an in-depth explanation of sparklines in Excel. It thrives to throw light on pointers such as what are sparklines, how you can insert them, what are their different types, why are they used, and how to customize them.
So, let us get started.
What are sparklines in Excel?
Sparklines have found their application in the representation of data. A sparkline in Excel is a tiny-sized chart that demonstrates trends, seasonal ups and downs, economic cycles, and the like. It facilitates an interpreter with the representation of a quick overview of the trends in the data.
Their compactness makes way for placing them much closer or nearer to the data. It has the ability to into a single cell without disturbing any formatting or values in the sheet.
What are the different types of sparklines in Excel?
Here are the different types of sparklines:
- Line – a line sparkline is demonstrated as lines, with the height of the differences indicating fluctuations in the data
- Column – similar to a bar/column chart, a column sparkline is represented using columns or bars. Each bar indicates a single value.
- Win/Loss – differentiates negative and positive values. Negative values are depicted by the downward flow of bars. Whereas, positive values are depicted by the upward flowing bars.
Why do we need sparklines?
Sparklines in Microsoft Excel come in handy for individuals involved in data interpretation and analysis. They have found use cases in nearly every industry now. Here’s a sneak peek into some of its prominent benefits, use cases, and applications indicating why businesses and individuals need sparklines.
- Data visualization purposes for analyzing data types for examples such as stock market prices and temperature levels
- Analyzing and generating reports for data
- Helps in faster analytics and interpretations because of its compactness
- The flow of trends and fluctuations are better understood
- Auto-adjustment of their sizes is yet another impressive feature sparklines come with
Steps to insert sparklines in Excel
Let’s learn to insert sparklines in Excel with the help of a sample dataset. Follow the steps illustrated below to insert sparklines for a dataset.
To start, we will require a sample database in hand that contains positive and negative values. You can use this mini dataset to practice sparklines.
| Products | Mon | Tue | Wed | Thu | Fri | Sat | Sun |
| ThinkBook | 4 | 6 | -2 | 8 | 7 | 19 | 21 |
| MacBook | -3 | 5 | 6 | 0 | 4 | 8 | 10 |
| Chromebook | 5 | -3 | 0 | 2 | 8 | 12 | 11 |
| Surface X | 3 | 4 | 6 | 7 | 0 | 9 | 10 |
| Inspiron | 5 | 7 | 8 | 6 | 0 | 14 | 23 |
- Now, insert a Sparkline in the column adjacent to the “Sun” column.

- Next, go to the Insert tab, under the Sparklines group, select any sparkline type you prefer.
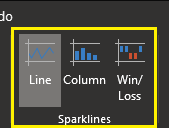
- You should now see a dialogue box in front of you. This utility will allow you to select a data range of your choice.
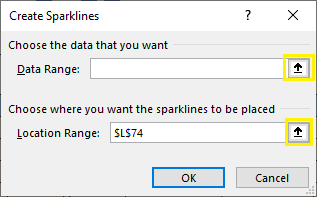
- Next, you must select a location range. This refers to the location where you want to place your sparklines.

- Check if the ranges you have selected look fine.
- Click OK.
The sparkline will be inserted successfully.

Follow the same steps to insert a Column type and a Win/Loss type sparkline.
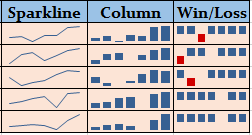
Finally, this is what the complete dataset now looks like:

Customizing sparklines in Excel
You also have the option to change how your sparklines look. Let us learn to customize sparklines in Excel.
Follow the steps below to customize sparklines in Excel.

- To change the type of a sparkline, select it and navigate to the Sparkline tab. Then, from the Type group, select any type of sparklines you like.
- To add markers to your sparklines, look for the Show group under the Sparkline tab. Select and check the options of your preferred choices.
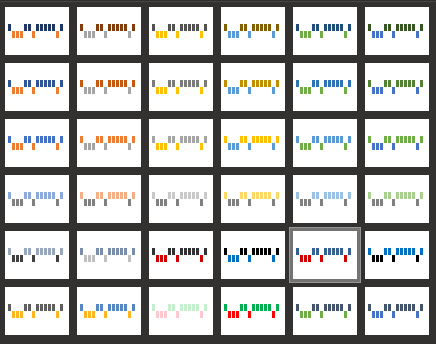
- To change the color and design of your sparklines, look for the Style group. You can either select from the pre-made designs from Microsoft or choose to customize them from scratch.


The Group section/group allows you to change the view and type of axis for the sparklines. You can clear out the sparklines by selecting the Clear button.
Conclusion
This Excel tutorial for beginners covers an in-depth explanation of sparklines in Microsoft Excel. We learned what are sparklines, how you can insert them, different types of sparklines, and why are they used, and how to customize them.
