In this tutorial, we’ll learn how to calculate Confidence Interval in Excel. But before that, let’s begin by understanding what it exactly is and how the calculation works.
Also read: How to Calculate Variance in Excel?
What is Confidence Interval?
Suppose we are making a population count. It can be very difficult if the number is large. So we do it for a small portion of the total population and implement by assumption the observation for the whole population statistically. This gives a generic idea about the total population.
But, this would cause an error, to come to a single (absolute value) since we are assuming the same result for the whole population. Therefore, it is more appropriate to give the result in an interval of numbers instead of a single number. This interval is called Confidence Interval (or CI).
We can calculate Confidence Interval on Excel with the help of the ‘CONFIDENCE‘ function. The CONFIDENCE function gives us the ‘Confidence Value’, which we use further to calculate our confidence interval.
Terms related to Confidence Interval
Before we move let me discuss one more factor that is used to calculate CI is Confidence Level.
Let’s say 99% confidence level, which means 99 out of 100 repeated experiments resulted in true mean. Generally, people use a 95% confidence level, but it’s totally up to your wish.
Excel Formula for Confidence Interval
The Excel CONFIDENCE function requires three arguments: Alpha, Standard Deviation, Size.
=CONFIDENCE.T(alpha, standard_deviation, size)Where:
- Alpha: Alpha Value is the Significance Value calculated as ‘(1-Confidence Level)/100‘.
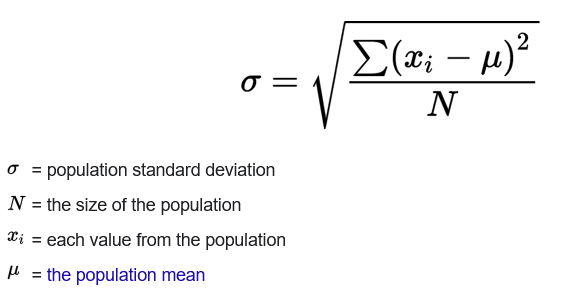
- Standard Deviation: It is the simple statistical term which we study in mathematics. To calculate standard deviation we have to find the mean of our data set. Then find the difference of the mean and each term and then the mean square of the differences. For the last step take the square root of the value obtained to get the standard deviation.

- Size: It is the total number of individuals we entered in our data set. For example, if we are taking the age of Five people as the entries, the value of size is 5.
Steps to find Confidence Interval in Excel
Let’s get right to finding the confidence interval using Excel formulas.
Method 1: Using Confidence formula
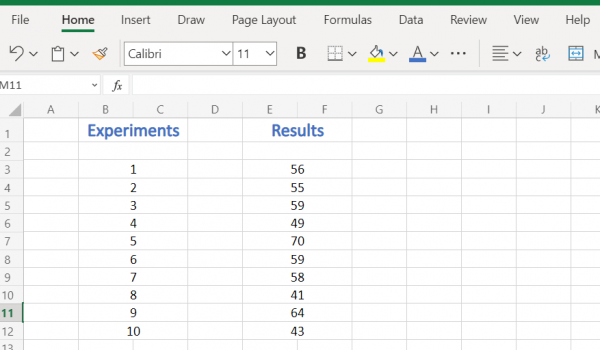
Step 1: Make the entry of your data set

Open an excel sheet and enter the values of individuals in a serial. An illustration of the entry is shown above with ten entries.
Step 2: Calculate Alpha, Standard Deviation, and Size
Assuming the confidence level of 95%
- Alpha Value = (100 – 95)/100 = 0.05
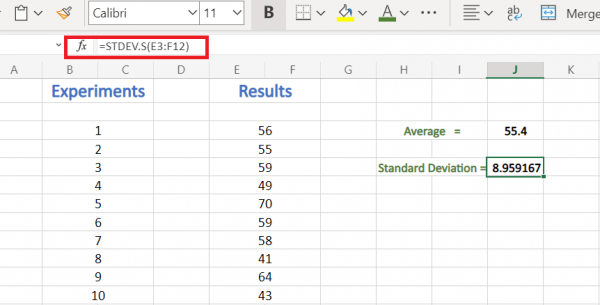
- To calculate Standard Deviation we have to find the average of individuals. To find the average apply the formula =AVERAGE(n1, n2,..). You have to calculate Average of all the data entries [Results – as in our example =AVERAGE(E3:F12)]
For the above values, the average we got is 55.4.
Now to calculate standard deviation operate the formula =STDEV.S(n1, n2, ..)
[=STDEV.S(E3:F12) in our example]
Standard Deviation is 8.959166628

- Since we have taken 10 entries, the size value is 10.
Step 3: Operate the Confidence function

- Alpha value = 0.05
- Standard Deviation = 8.959
- Size = 10
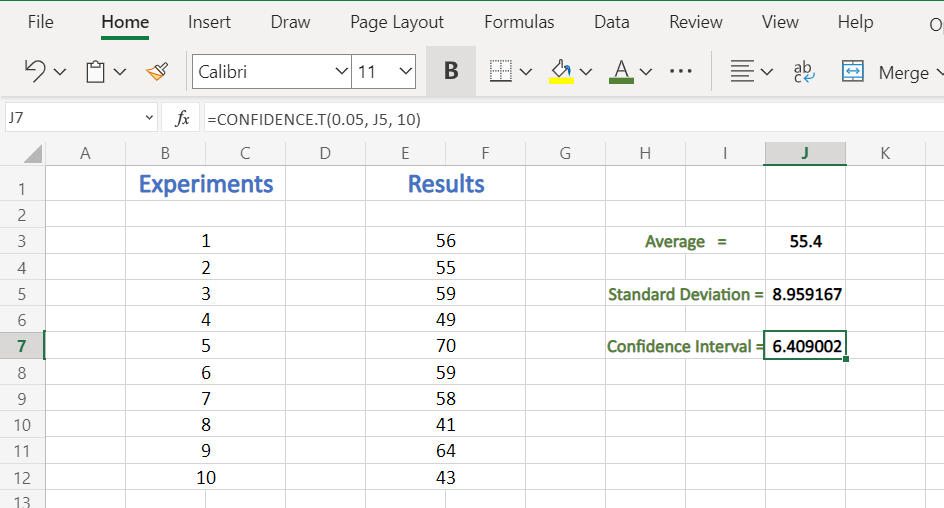
Put the values in the formula below:
=CONFIDENCE (0.05,8.499,10)

The Confidence Value we obtained is 6.409002
Step 4: Find Confidence Interval using Confidence Value
We can find the Confidence Interval by adding and subtracting the confidence Value from the average value.
CI (Confidence Interval) = Average ± Confidence Value
Upper CI = 55.4 + 6.41 = 61.81
Lower CI = 55.4 — 6.41 = 48.99
So our final Confidence Interval is: 61.81 — 48.99
Method 2: Using Excel ToolPak
To calculate Confidence Interval using Inbuilt tools, you need to activate the ‘ToolPak‘ in Excel first. Follow the steps below:
- Go to the Files, select Options
- Click on Add-ins. You will find that in the left column.
- Now you click on Manage and you will find Excel Add-ins on the bottom. Click on it and then Go.
- Now you find the list of available Add-ins. Select ‘Analysis ToolPak’ and ‘Solver Add-in‘ and then confirm by selecting OK.
- Now you find the Data tab at the top dashboard of the screen click there and then Data Analysis on the top right of the screen.
- Click on it and the new window will show up containing a Data Analysis Tool list. Select the Descriptive Statistics option and then OK.
- A new window will appear, asking for Input Range at first. You can enter the entries manually or select the column and then paste it.
- Then you will be asked to select an Output Option. You should go for the New worksheet option to get your output as I recommend. Also, there is an option for New Workbook to get the result in an entire new excel document.
- Below you will find Summary Statistics select it. This will give you the mean, standard deviation, etc. Below this, you will get an option Confidence Level of Mean. Select this too and you can adjust the confidence level here which is set to 95% by default.
- Now click on the OK button to run the calculation.
The analysis of your data set will be displayed on a new excel sheet. The analysis will include Mean, Standard Error, Median, Mode, Standard Deviation, Confidence Value as Confidential Level, Kurtosis, Minimum, Maximum, etc.
Conclusion
And that’s how you calculate the confidence interval in Excel. With that, I’ll leave you to try your learning out on your own Excel and let us know how you liked it. Also, don’t forget to come back for more tutorials on Excel!
