Z-score in Excel is a statistical measurement that describes the relationship between a value and the mean of a set of values. The standard deviations from the mean are used to calculate the Z-score. When a Z-point score is 0, the score of the data point is the same as the mean.
A data point that is one standard deviation from the mean is given a Z-score of 1.0. Z-scores can be either positive or negative, with a positive number indicating that the score is higher than the mean and a negative value suggests that it is lower than the mean.
Also read: How to Calculate the Weighted Average in Excel?
Z-Score Calculation
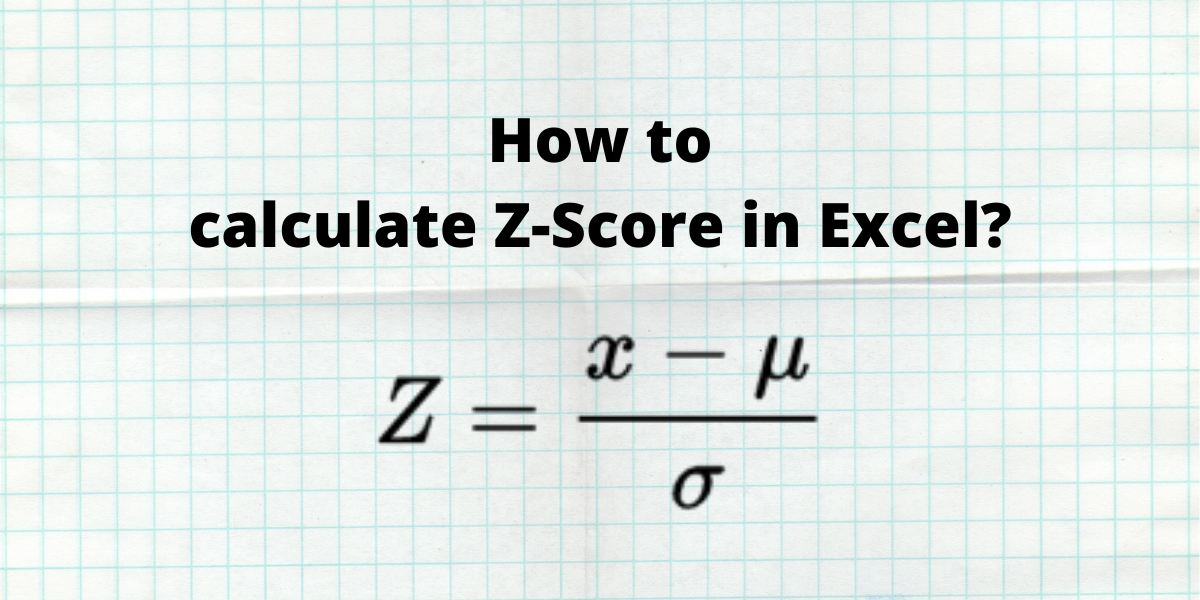
Z score is calculated using the formula below:

Where Z is the Z-score value,
- x is the data value to be standardized
- µ is the mean of the given set of data values
- σ is the standard deviation of the given set of data values.
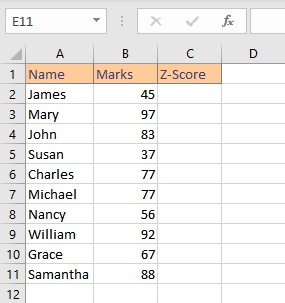
It is very easy to calculate Z-score in Excel. In this article, we will learn how to calculate Z-score in Excel for a sample dataset. Let us consider a sample dataset of students with their marks. We need to calculate their Z-scores for grading purposes.
1. Calculating the Mean or Average
The mean is the average or the most common value in a set of numbers. Mean is a parameter in the formula for z-score. To calculate the mean in Excel, we use an in-built AVERAGE function. The syntax of the AVERAGE function is =AVERAGE(start cell reference:end cell reference).
- Select the cell where you want to display the mean.
- Type the formula =AVERAGE( and select the data range containing the values for which mean value is sought and finish the formula with ).
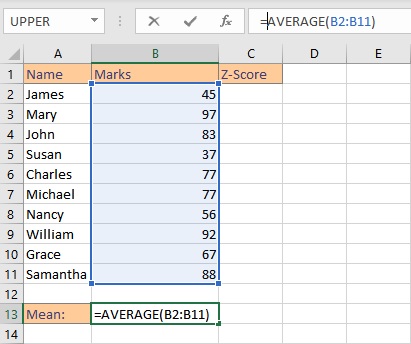
- Press the Enter key to display the result.
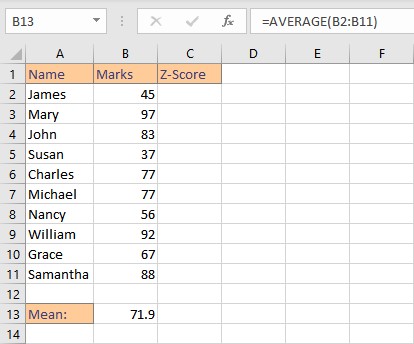
In this example, we enter the formula =AVERAGE(B2:B11) in cell B13, to get the mean of the marks obtained by students.
Note: The AVERAGE function ignores empty cells and cells that do not include any numbers.
2. Calculating the Standard Deviation
Standard Deviation is a statistical measurement that measures the distribution of the data points in a dataset relative to its mean or average value. Higher deviation within the dataset implies the data values are distributed further from the mean.
To calculate the mean in Excel, we use an in-built STDEV.S function. The syntax of the STDEV.S function is STDEV.S(n), where n is the list of numbers separated by commas or the cell references containing the numbers. Follow these steps to calculate the standard deviation of marks scored by students;
- Select the cell where you want to calculate and display the standard deviation.
- Type the formula =STDEV.S( and select the data range containing the values for which mean value is sought and finish the formula with ).
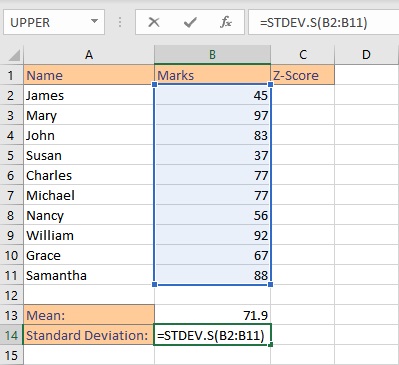
- Press the Enter key to display the result.
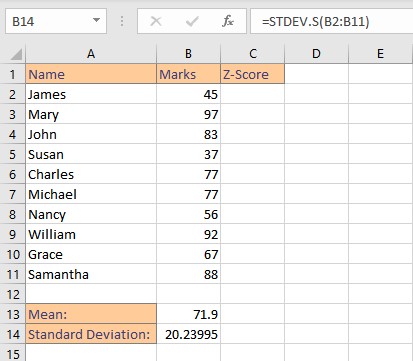
Note: The STDEV.S function ignores logical values and text in the selection.
Calculating the Z-Score in Excel
Now that we have both the mean and the standard deviation of our dataset we can calculate the z-score in Excel by directly applying the formula as mentioned above or by using an inbuilt function STANDARDIZE.
1. Calculating Z-score using formula
- Select the cell where you want to calculate and display the z-score in Excel
- Type the formula =(B2-$B$13)/$B$14, where B2 is the cell reference of the data point for which z-score is sought, B13 is the cell reference for the mean value and B14 is the cell reference for the standard deviation value. The $ sign is added to the cell references to make them constant.
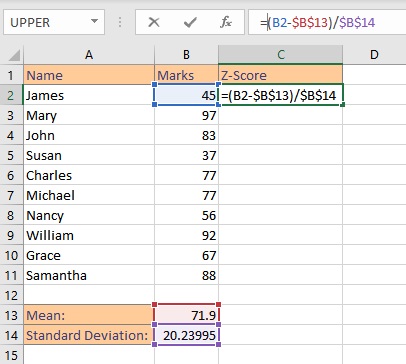
- Press the Enter key to display the calculated z-score for a single entry.
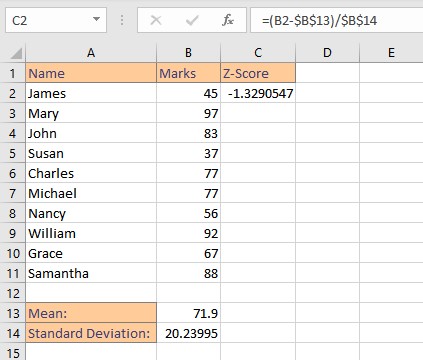
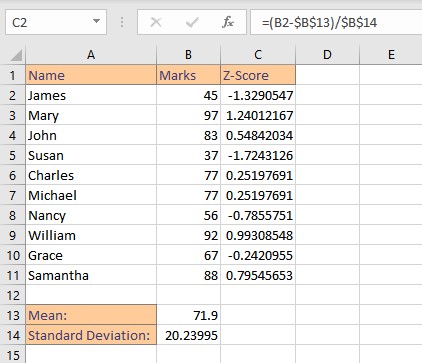
- Copy the formula for the entire dataset by dragging down the fill handle.
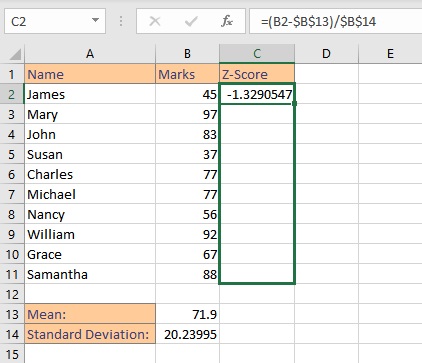
- Release the mouse button to display the calculated z-scores for the entire dataset.
2. Using the STANDARDIZE function
The STANDARDIZE function returns a normalized value from a distribution with mean and standard deviation as parameters. Syntax: STANDARDIZE(x, mean, standard_dev), where x is the data value to be standardized, mean is the average value of the given set of data values, and standard_dev is the standard deviation of the given set of data values.
- Select the cell where you want to calculate and display the z-score in Excel.
- Type the formula =STANDARDIZE(B2,$B$13,$B$14), where B2 is the cell reference of the data point for which z-score is sought, B13 is the cell reference for the mean value and B14 is the cell reference for the standard deviation value. The $ sign is added to the cell references to make them constant.
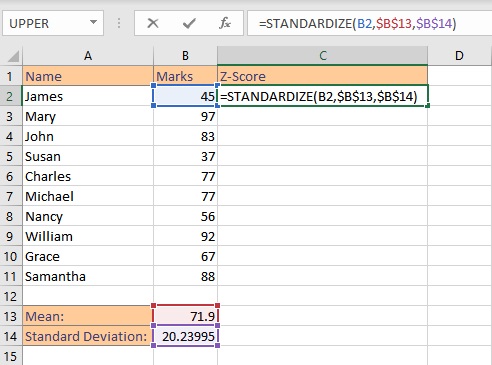
- Press the Enter key to display the calculated z-score for a single entry.
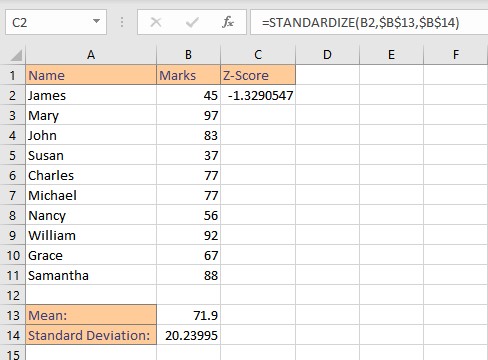
- Copy the formula for the entire dataset by dragging down the fill handle.
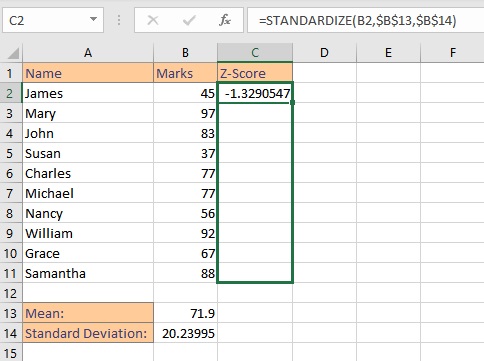
- Release the mouse button to display the calculated z-scores for the entire dataset.
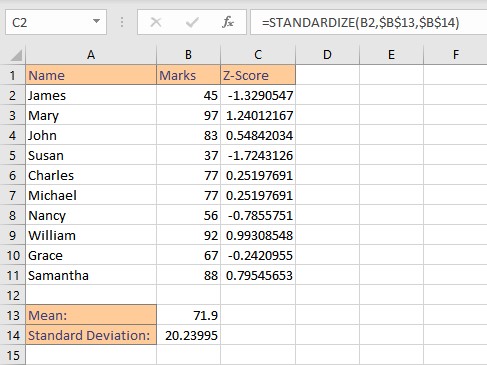
Note: If the standard deviation of a dataset is less than or equal to 0, the STANDARDIZE function returns the #NUM! error value.
Conclusion
In this tutorial, we learned how to calculate z-score in Excel for a sample dataset using the STANDARDIZE function as well as directly by applying the mathematical formula.
