y = mx + c
It all started with the above equation, isn’t it?
Y – Y-axis value; X – X-axis value; m – slope; c – intercept.
Math sought a helping hand from the alphabets & from thereon they became an integral part of the subject. The alphabets got inter-twined so much that their place within the realms of Math, was etched down to its roots, making them an undeniable essence of the field.
What is this slope?
What significance does it possess?
All these questions will be answered in this article when we pull this slope equation into MS Excel & apply a use case to see how it fares in solving it.
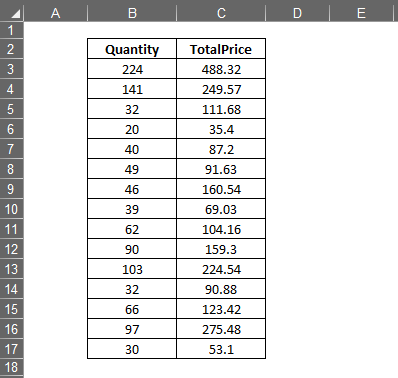
A sample set of values such as the list given below will be considered to find out the slope.
The Slope Formula:
Before we get on with knowing what the formula for calculating slope is, let us get to know what slope is?
Slope is a metric to find the correlation between the set of values along the X-axis & Y-axis. The resultant can be a positive co-relation when an increase in value along one axis will also result in a proportional increase in value along the other axis. By what proportion do you ask? That shall be in accordance with the number that is calculated as the slope.
The converse is also true, where an increase in value along one axis can result in a proportional decrease in value along the other axis. Back to the formula now! As with any formula in MS Excel, this too starts off with an equals sign (=) with the below syntax,
=SLOPE(known_ys, known_xs)
Known_ys stated within the brackets refer to the values along the Y-axis while known_xs are those along the X-axis. Let us get started with finding the slope of the sample data stated above.
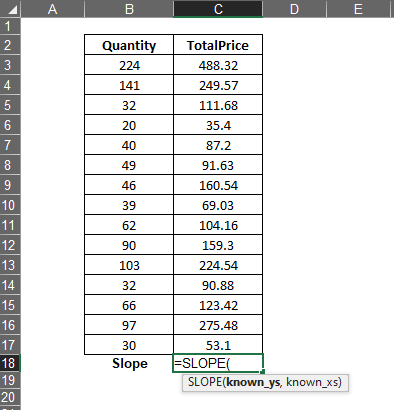
Get the active cell to the bottom of the data as shown in the image below & start typing SLOPE preceded by an equals sign.
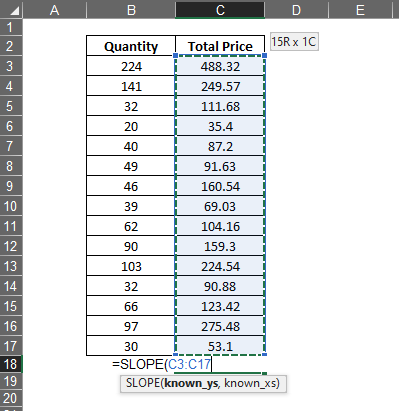
Once done, include an opening bracket & select the cells containing the values that fall along the Y-axis, which in this case would be those under the column titled Total Price. Left click on cell C3 & without lifting the finger off the left mouse button, drag until the selection reaches cell C17.
Once done, include a comma (,) after the selected range that is displayed within the formula & it is time to select the known_xs. This is done by clicking cell B3 & dragging the selection till it reaches cell B17.
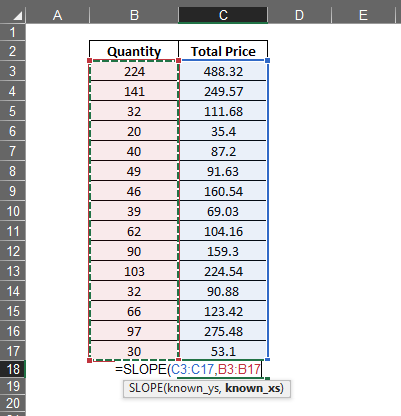
The formula now has been fed with all the required inputs & now can be ended by using a closing bracket as shown below.
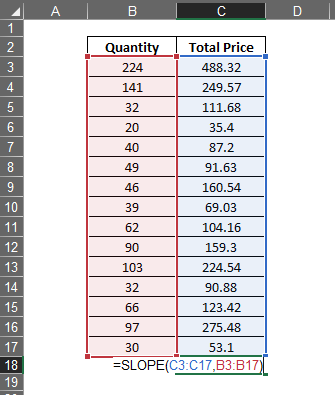
Hit ENTER & the value calculated would appear!
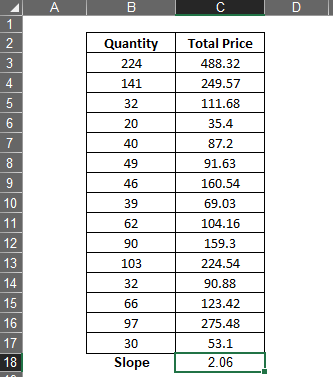
Now that we have got a value of slope as 2.06, what inference can we deduce from this?
This essentially means that for every 1 pc increase in the value of Quantity, there would be a 2.06 increase in the Total Price.
Conclusion:
Now we have reached the end of this article detailing on how to calculate Slope using the built-in formula available in MS Excel & hope that got what you were looking for. But what if you want to know more about these built-in formulae in MS Excel? We knew that it would get down to this & we have just the article that provides the necessary details – How to Use Formulas in MS Excel? QuickExcel has numerous other articles too that can come in handy for those who are in a quest to know something more in MS Excel. Ciao!
