The header row plays an important role in tabulated data. Without those, we would be lost in interpreting what the data in each column mean. The header row would be at the very top, in fact, the very first row of a tabulation would mostly be the header row!
Not all tabulations can be contained in the visible part of the worksheet. While some can argue that a bit of zooming out would solve the issue, but if one zooms out to get a better view of tabulation with thousands of rows, it doesn’t serve the purpose. Not only the header row would shrink itself but also the other entries would also go way too small.
To put things in perspective, let us consider the following tabulation of data.
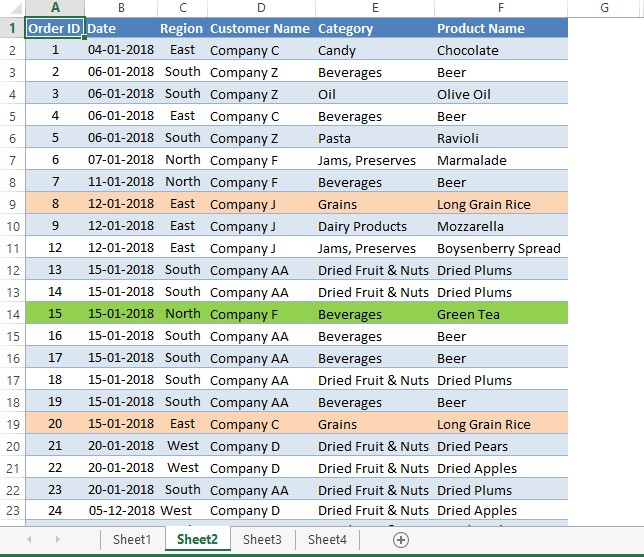
But not all the entries are visible here! Below is an image of the same tabulation when we get to the very bottom of it.
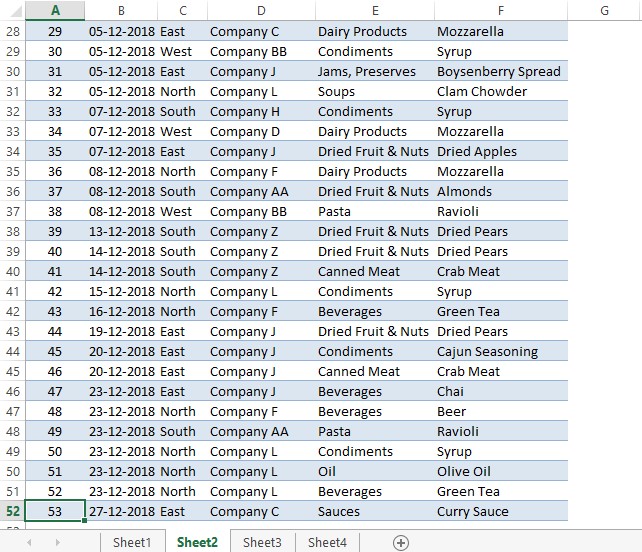
It is clear from the above image that we can only guess what the entries of each column tend to convey in the absence of the header row indicating what is what. It becomes even more difficult when we tend to find what the entries under the columns E & F really mean.
Seems that the grievance has been taken up already to the MS Excel developers & they have addressed this issue using a feature known by the name, Freeze Panes.
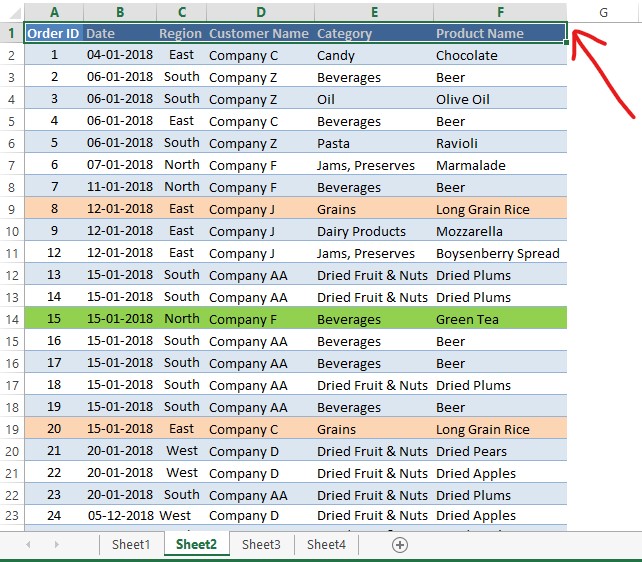
Before getting on to find where this option is, let us select the very first row which indicates what data is provided in the respective columns as shown below.
Once done, one can find the location of the Freeze Panes by getting into the View tab as shown in the following image.
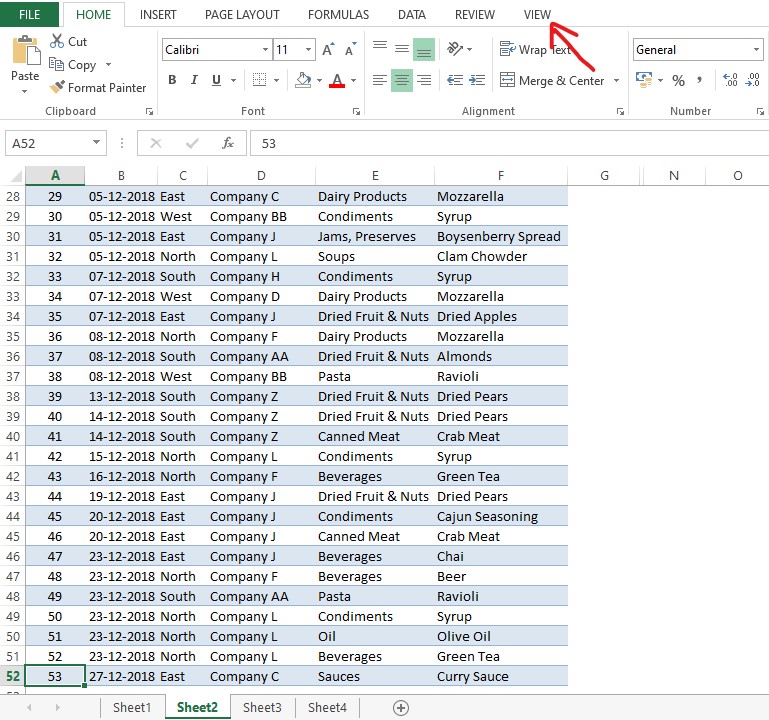
Once, the View tab is clicked, all the options it has to offer become visible & we shall click on the Freeze Panes option as shown in the below image. It drops down a list of options to choose from & we would be clicking on the Freeze Top Row.
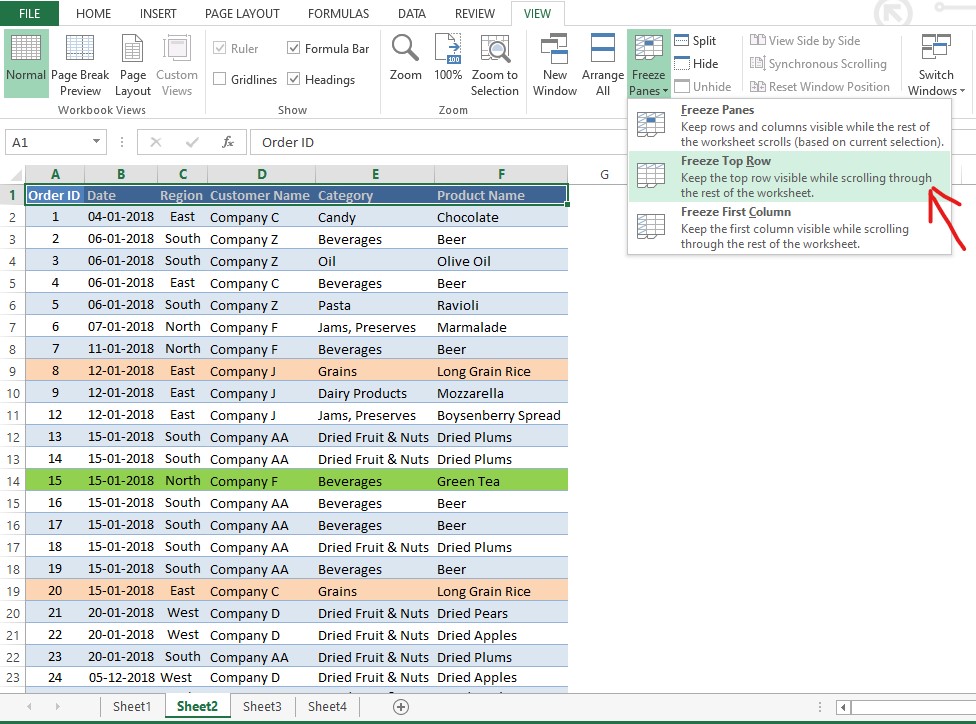
Once done, it freezes the selected row in its position & however lower we scroll it still is visible at the top. The following image explains it better where we get to the bottom of this tabulation again as we did at the beginning of this article & the header row still remains visible at the top!
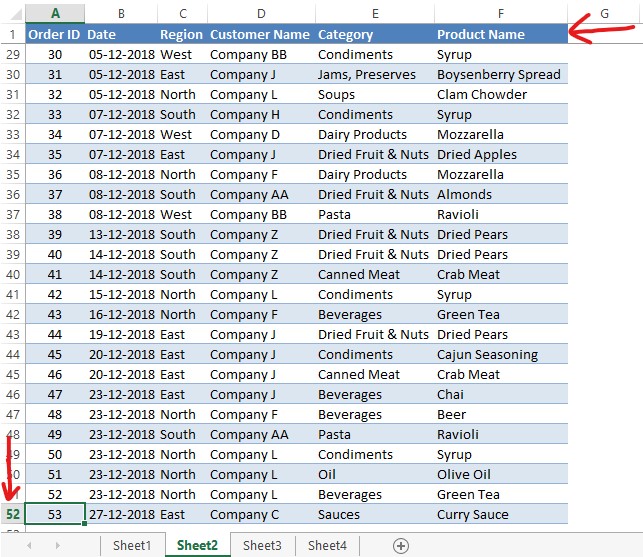
This feature of freezing a row is not only limited to its topmost position but also can be extended to any row irrespective of its position in a worksheet. Only the option that needs to be chosen within the Freeze Panes would vary in this case.
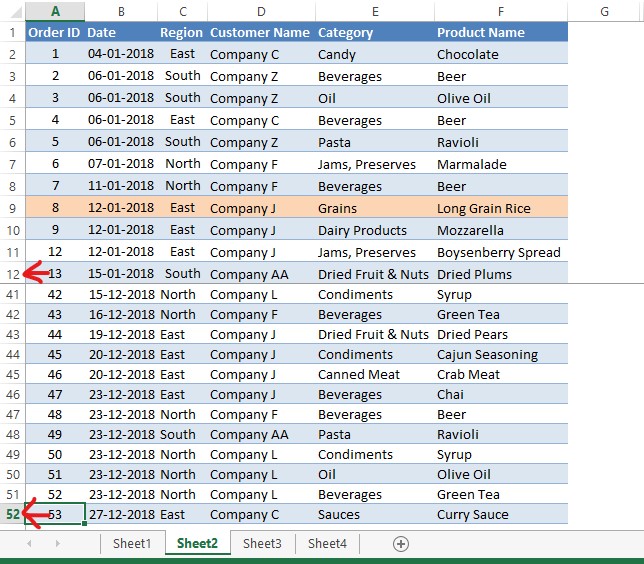
One has to choose Freeze Panes in the drop-down list appearing after clicking on the Freeze Panes option to make this happen. Let us consider the following example where we need to pin rows from 1 to 12 to remain fixed when we scroll below the tabulation. In this case, all the entries between rows 1 & 12 are to be selected as shown below.
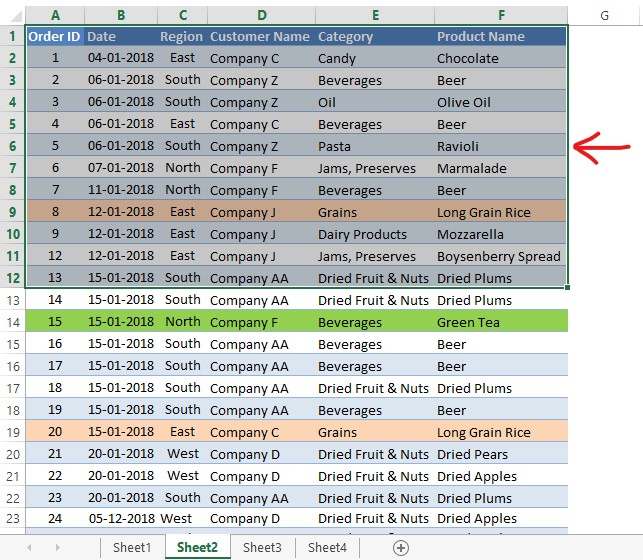
Once done, click on the Freeze Panes option within the View tab & select Freeze panes in the drop-down list as shown in the below image.
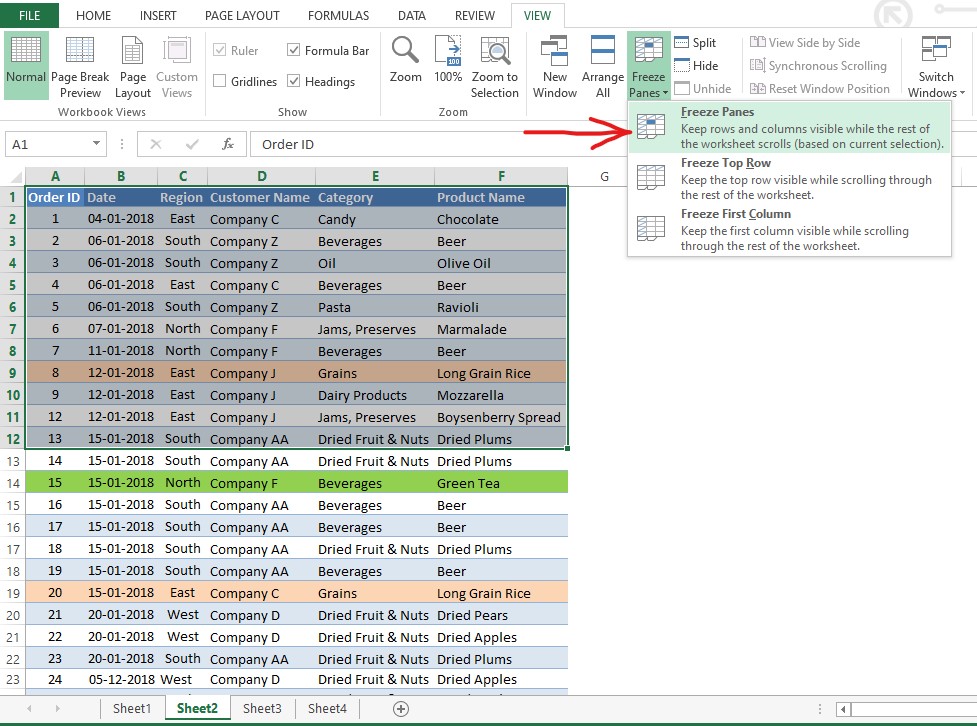
This would pin all the selected rows while one can freely scroll to any part of the tabulation as shown below.
Conclusion:
Now we have reached the end of this article on how to pin a row in MS Excel. QuickExcel has numerous other articles too that can help those who are looking to explore MS Excel. Here’s one which deals with removing excessive spaces within the data recorded in a spreadsheet. Wishing you all the very best in Mastering MS Excel. Cheers!
